- Metric name
- Gross merchandise value (GMV)
Custom BI and Reporting
Business Intelligence Dashboards for KPI & Ops Reporting
Nenodata connects and prepares fragmented business data for custom operational and executive reporting dashboards focused on KPI definition, visualization, and decision-ready views.
Documented KPI definitionsExecutive and operational viewsImplementation-specific refresh planning
Illustrative example
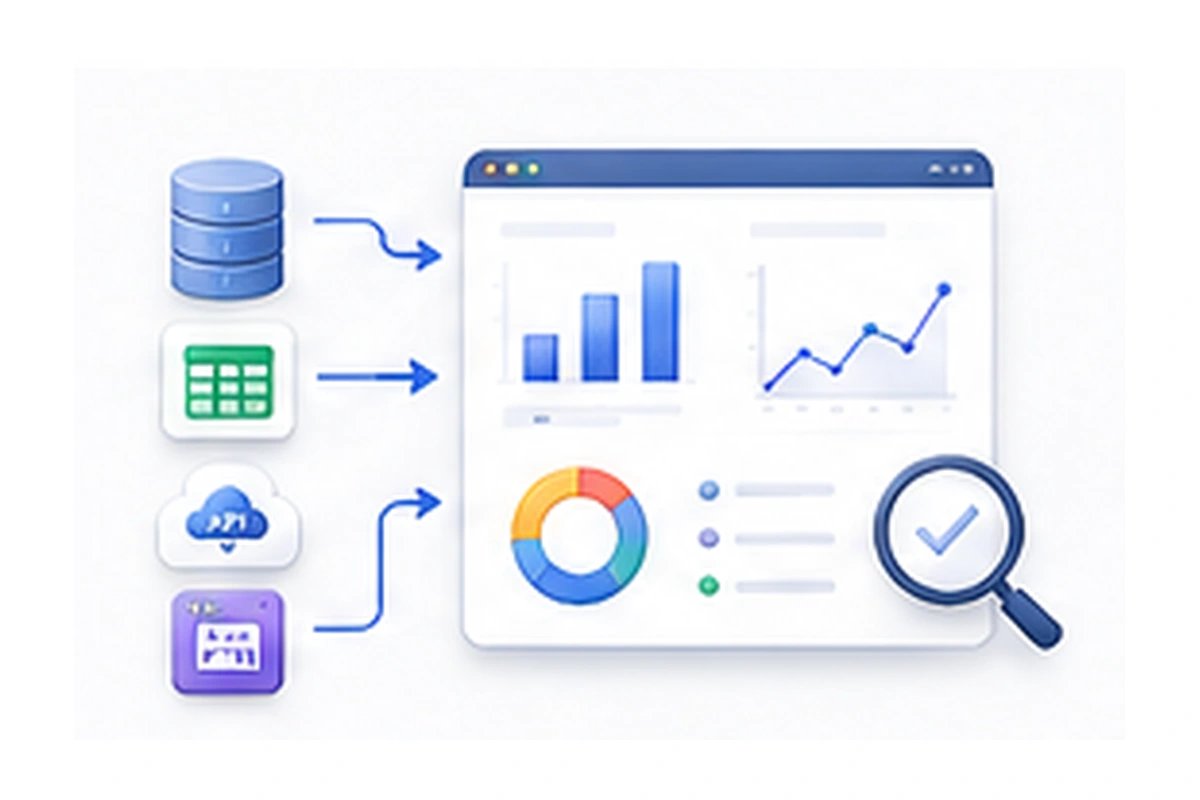
Why reporting breaks as the business grows
As teams add sources and stakeholders, charts alone are not enough. Reporting breaks when KPI definitions, source mapping, transformation logic, validation, and ownership are unclear.
Spreadsheet exports and one-off visuals create conflicting numbers across leadership, operations, and analytics teams.
Without an agreed reporting model, dashboards become presentation layers that cannot explain freshness, exceptions, or why a metric changed.
What Nenodata provides
Nenodata scopes dashboard users, decisions, KPI definitions, source readiness, and delivery environment before design and build begin. Upstream collection and preparation can connect through custom data pipelines when ingestion and transformation are part of the engagement. The focus of this service remains user-facing reporting: KPI planning, dashboard UX, visualization, validation, and launch support scoped to the project.
BI dashboards vs pipelines and observability
Use this page for KPI definitions and executive/ops views. Use custom pipelines to build the feed, or pipeline observability to watch schema drift — not to design dashboards.
| Source | Best for | Learn more |
|---|---|---|
| BI dashboards | KPI definition, executive/ops views, and reporting UX | This service |
| Custom pipelines | Extraction-to-delivery workflows you own end to end | Custom pipelines |
| Pipeline observability | Schema-drift alerts, run status, and delivery holds | Pipeline observability |
Sample dashboard and proof format
Illustrative example

KPI-definition template
Illustrative example
- Business definition
- Completed order value after cancellations, before refunds
- Calculation
- SUM(order_value) WHERE status = completed
- Source
- Orders warehouse table + payments feed
- Filters
- Exclude test accounts and internal orders
- Owner
- Revenue operations
- Refresh frequency
- Hourly batch, last successful 2026-08-12T14:00:00Z
- Exceptions
- Hold card if payments feed is >2 hours stale
| Definition item | Illustrative entry |
|---|---|
| Metric name | Gross merchandise value (GMV) |
| Business definition | Completed order value after cancellations, before refunds |
| Calculation | SUM(order_value) WHERE status = completed |
| Source | Orders warehouse table + payments feed |
| Filters | Exclude test accounts and internal orders |
| Owner | Revenue operations |
| Refresh frequency | Hourly batch, last successful 2026-08-12T14:00:00Z |
| Exceptions | Hold card if payments feed is >2 hours stale |
Dashboard mockups, KPI templates, and source maps on this page are illustrative. Final fields, metrics, platform, and delivery scope depend on discovery.
Business Intelligence Dashboard Services
Dashboard strategy and KPI planning
Define the decisions each view must support and document agreed metric logic before design begins.
Data-source integration
Assess and connect approved sources needed for the reporting model, without assuming every system is ready by default.
Data preparation and reporting models
Prepare fields, joins, and transformations into a reporting model that matches stakeholder definitions.
Dashboard design and development
Build executive and operational views with clear hierarchy, filters, and readable visualization patterns.
Executive and operational reporting
Deliver summary views for leadership alongside detailed views for day-to-day operating teams.
Interactive analysis
Support filters, breakdowns, and drill-downs scoped to the questions each audience needs to answer.
Refresh setup and monitoring
Plan implementation-specific refresh methods and make freshness and failure states visible in the reporting experience.
Testing and reconciliation
Validate displayed figures against source logic and documented KPI definitions before launch.
Documentation and support
Provide metric documentation and scoped launch support so ownership continues beyond the initial build.
Dashboard types aligned with business decisions
Executive performance dashboard
Leadership views that summarize approved KPIs, period changes, and exception states for decision meetings.
Sales and revenue dashboard
Pipeline, revenue, and conversion reporting aligned to documented sales definitions and filters.
Ecommerce performance dashboard
Catalog, conversion, availability, and channel performance views for retail and ecommerce operators.
Pricing and competitor dashboard
Pricing and competitive-position reporting that can connect to monitored market signals when scoped.
price intelligenceMarketing performance dashboard
Campaign and channel reporting with shared definitions across acquisition, engagement, and conversion metrics.
Operations dashboard
Operational throughput, backlog, quality, and service-level views for teams managing day-to-day execution.
Real estate and market dashboard
Market, inventory, and performance reporting for real-estate and related decision workflows.
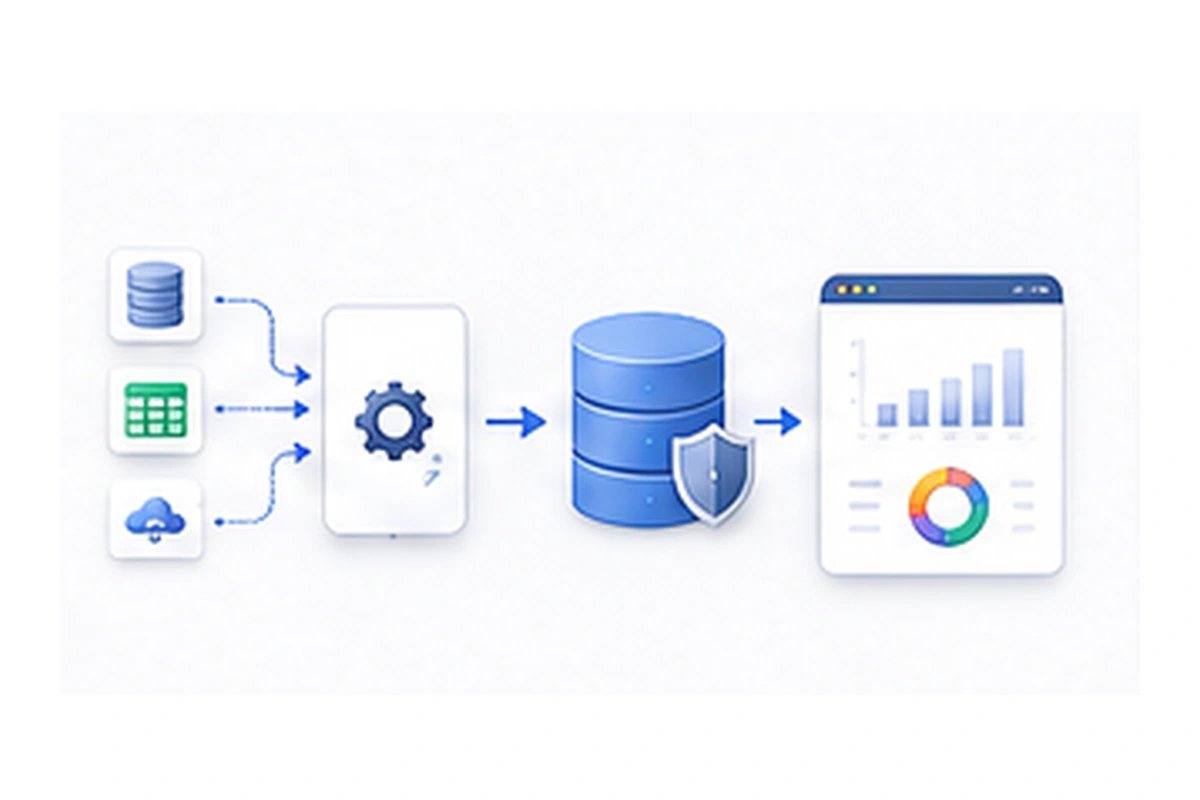
Data sources and delivery environment
Illustrative example
External and web data
- • Approved public websites
- • Monitored market sources scoped for reporting
Files and exports
- • CSV
- • Excel
- • Structured business exports
APIs and webhooks
- • Approved API feeds
- • Event or webhook updates where available
Databases and warehouses
- • Operational databases
- • Analytics warehouses scoped during discovery
CRM, ERP and business-system data
- • CRM extracts
- • ERP exports
- • Other approved business-system datasets
Dashboard and reporting delivery
- • Interactive dashboard views
- • Filtered team views
- • Export or distribution options scoped in delivery design
Related: custom data pipelines, workflow automation, what is a BI dashboard, and AI for business intelligence.
Who this service is for
This service is for executives, operations leaders, analytics teams, ecommerce and retail teams, pricing functions, revenue operations, and product teams that need decision-ready reporting.
It also fits businesses replacing manual spreadsheet reporting with documented KPI logic, clearer ownership, and views designed for the people who use them.
How the engagement works
- 1
Define users and decisions
Identify who will use the dashboard and which decisions each view must support.
- 2
Map metrics and data sources
Document KPI definitions, calculations, filters, owners, and the sources required to support them.
- 3
Connect and prepare the data
Assess source readiness, prepare the reporting model, and establish validation expectations.
- 4
Design, build and validate
Develop dashboard views and reconcile displayed figures against agreed metric logic before launch.
- 5
Launch, document and support
Release the reporting experience with documentation and scoped support for ownership after launch.
For Nenodata’s broader source-to-delivery process, see how Nenodata works.
Why choose Nenodata
Upstream data capability
Nenodata can work with data that is not already dashboard-ready by preparing sources into an agreed reporting model.
Custom source assessment
Each source is reviewed for feasibility instead of assuming every system will connect by default.
Documented metric logic
KPI definitions, calculations, filters, and owners are documented so teams share one meaning for each number.
Validation before launch
Displayed figures are reconciled against source logic and approved definitions before the dashboard goes live.
Implementation-specific refresh planning
Refresh method and cadence are planned for the actual sources and delivery environment in scope.
Ownership beyond the initial build
Documentation and scoped support help teams maintain metric ownership after the first release.
Platforms, access and delivery
Platform selection, licences, access, hosting, and maintenance responsibilities are confirmed during scoping. Specific BI tools are named only when support is verified for the engagement.
- Existing or preferred reporting platform
- Customer-owned or provider-managed licences
- Authentication and user access
- Roles and permissions
- Data location and hosting
- Refresh method and frequency
- Export or distribution requirements
- Documentation and asset ownership
- Maintenance responsibilities
- Embedded reporting, only where verified
For validation, routing, and alert workflows around reporting inputs, see workflow automation.
Frequently asked questions
Bring your current reporting problem
Share the dashboard audience, reporting problem, data sources, required KPIs or sample reports, current platform, and expected refresh pattern so Nenodata can assess the next step.
Include who will use the dashboard, which decisions it must support, known metric conflicts, and any current spreadsheet or reporting examples.