AI & Automation
AI for Business Intelligence: Use Cases, Architecture, and Implementation
AI can help business users ask questions in plain language, create reports, identify anomalies, and summarize complex data. It cannot correct unreliable sources, undefined metrics, or weak validation by itself.
A dependable AI-powered business intelligence system requires:
- Trusted and sufficiently current data
- Consistent business definitions
- Validation and access controls
- An analytics or AI interface operating within those controls
Microsoft now provides dedicated Power BI features for defining AI data schemas, verified answers, and model-level instructions. Google’s Looker Conversational Analytics similarly grounds natural-language analysis in Looker’s semantic modeling layer. These approaches reflect the same principle: AI performs better when it receives clearly modeled data and business context.
AI-powered business intelligence begins before the prompt or dashboard. It begins with the data sources, definitions, and controls that determine whether an answer can be trusted.
What Is AI for Business Intelligence?
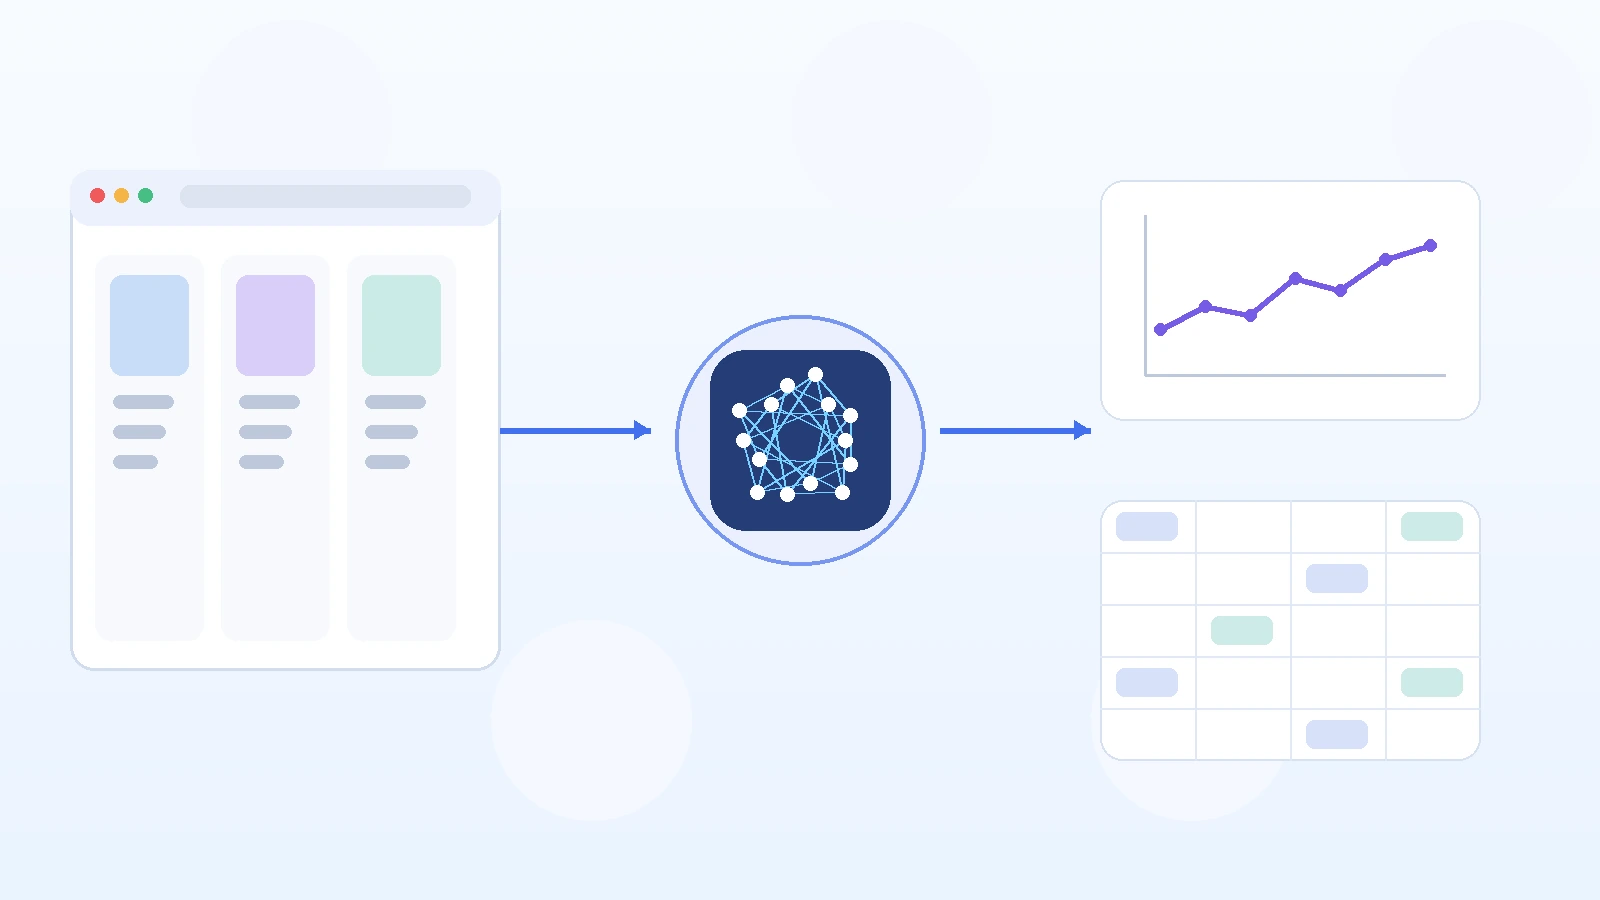
AI for business intelligence is the use of artificial intelligence to help prepare, query, analyze, explain, and monitor business data.
Depending on the platform and implementation, it may help users:
- Ask questions in natural language
- Generate queries or calculations
- Create visualizations
- Summarize reports
- Classify records
- Detect unusual changes
- Forecast possible outcomes
- Explain contributing factors
- Route exceptions for review
Power BI Copilot supports chat-based analysis and AI-assisted work with reports and semantic models. Looker lets users ask natural-language questions over governed Explore data.
These capabilities can reduce the effort required to answer routine questions. They do not remove the need for analysts, data engineers, metric owners, or human review.
Traditional BI vs. AI-Powered BI
Traditional BI generally relies on predefined reports, dashboards, filters, and analyst-created queries. AI-powered BI adds a more flexible interaction and analysis layer.
| Area | Traditional BI | AI-powered BI |
|---|---|---|
| User interaction | Reports, filters, and dashboards | Natural-language and AI-assisted analysis |
| Query creation | Often requires SQL or analyst support | AI can help translate business questions into queries |
| Insight type | Mainly descriptive | Descriptive, diagnostic, predictive, and sometimes prescriptive |
| Report creation | Designed manually | AI may draft visuals, calculations, and summaries |
| Monitoring | Scheduled reports and fixed thresholds | Pattern detection, summaries, and proactive notifications |
| Main dependency | Structured, modeled data | Modeled data plus approved context and instructions |
| Main risk | Slow or inflexible reporting | Convincing but incorrect or poorly grounded answers |
| Human role | Build and interpret reports | Define metrics, validate outputs, and approve important actions |
AI does not necessarily replace an existing BI platform. For many companies, the better approach is to improve the data and workflow layers feeding the existing analytics environment.
What AI Can Do Inside a BI Workflow
Natural-language analysis
Conversational BI allows a user to ask questions such as:
- Which product categories lost margin last month?
- Where did competitor availability change most sharply?
- Which regions experienced an unusual decline in orders?
- Which data sources failed to refresh today?
The system interprets the request, maps it to available data, and returns an answer or visualization. This is dependable only when the system understands the organization’s approved business definitions.
For example, “revenue” could mean:
- Gross booked revenue
- Recognized revenue
- Net revenue after refunds
- Revenue excluding tax
- Revenue converted into a reporting currency
Without an approved definition, an AI assistant may select the wrong measure while producing a plausible answer. Microsoft recommends preparing semantic models with AI-friendly schemas, verified answers, and specific instructions. Looker’s guidance similarly emphasizes governed semantic models and carefully configured data agents.
Summaries, reports, anomalies, and forecasts
AI can summarize dashboards, draft charts and calculations, flag unusual changes, and estimate outcomes under defined assumptions. Useful outputs should expose data limitations—such as stale sources or excluded records—rather than presenting every result as complete.
Generated reports still require review for correct measures, filters, joins, null handling, scales, chart selection, and unsupported conclusions. Anomaly records should explain when a change began, which records are affected, what baseline was used, whether validation passed, and how much of the total result is affected.
A forecast is not a guaranteed outcome. Its usefulness depends on historical data quality, model assumptions, and changing conditions. High-consequence recommendations should remain subject to human review.
The Data Foundation AI-Powered BI Requires
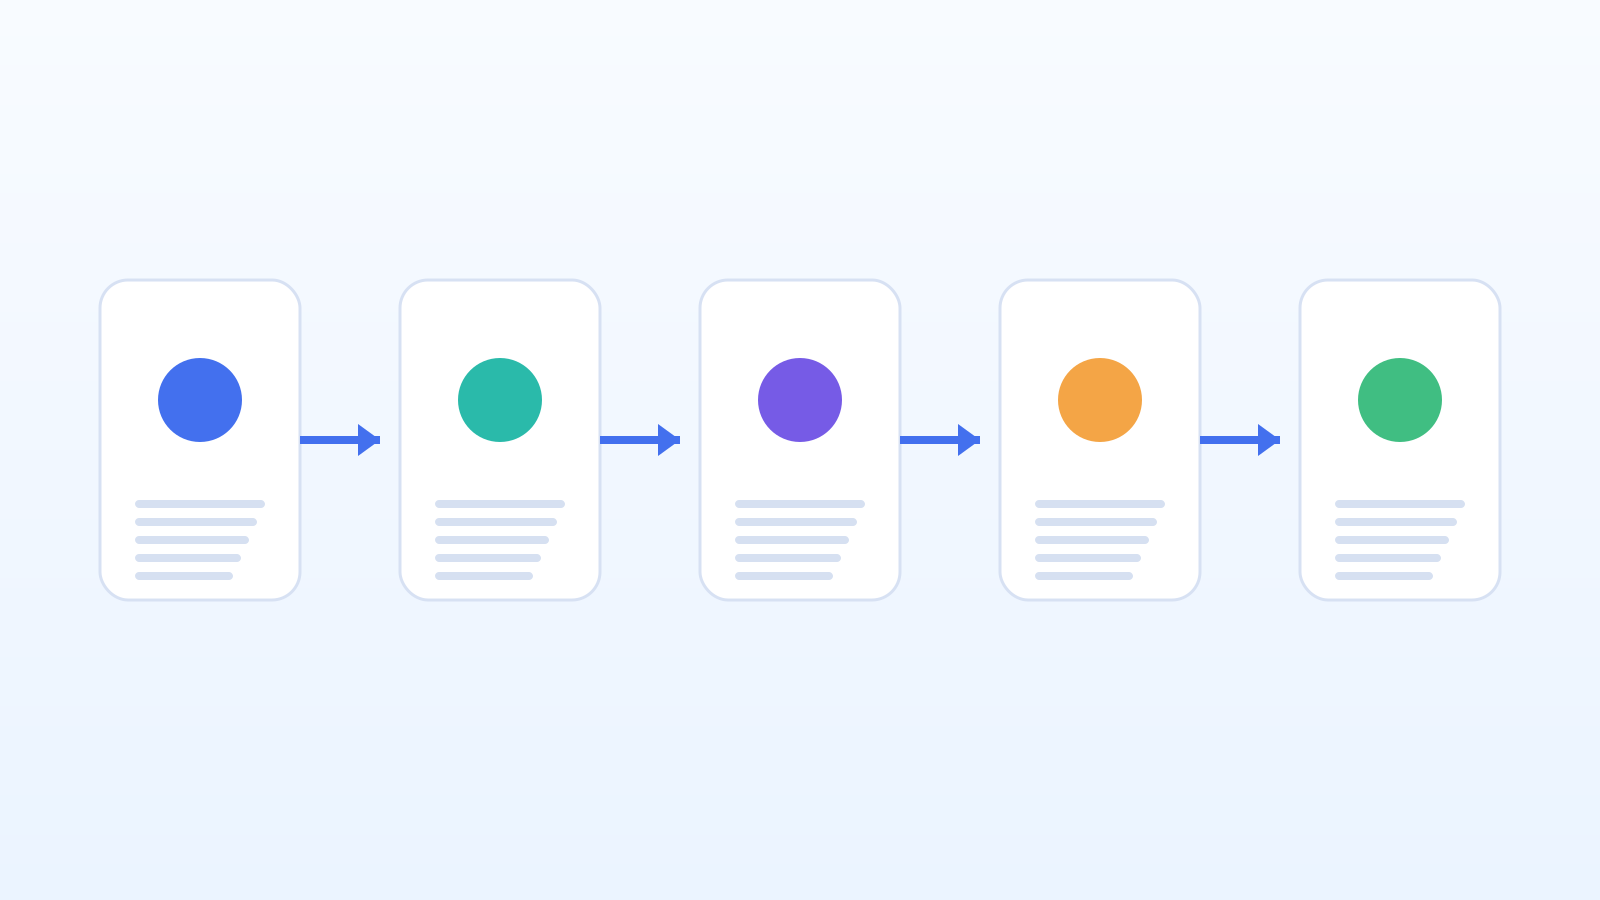
The AI interface receives most of the attention, but the data foundation usually determines whether the system is useful. A practical architecture includes five stages.
1. Identify the required sources
Business intelligence may use internal sources such as:
- CRM platforms
- ERP systems
- Transaction databases
- Support tools
- Data warehouses
- Internal APIs
- Product-information systems
It may also require external or unstructured sources:
- Competitor websites
- Marketplaces
- Public APIs
- Product catalogs
- News sources
- Reviews
- PDFs
- Invoices
- Statements
- Property listings
- Travel rates and availability
Nenodata’s current website describes workflows involving websites, documents, APIs, and databases, with structured output delivered into downstream systems or files.
Explore Nenodata’s data extraction services.
Common mistake: Beginning with “all available data” instead of identifying the minimum sources required to support one business decision.
2. Extract and structure the data
Raw sources rarely follow one common format. The same product might appear as Wireless Headphones Pro — Black, Headphones Pro Wireless BLK, WH-PRO-BLK, or Pro Wireless Headset, Black Edition.
The workflow must extract relevant fields and map them into an agreed structure. An illustrative record might look like this:
{
  "entity_id": "WH-PRO-BLK",
  "entity_name": "Wireless Headphones Pro",
  "variant": "Black",
  "source_name": "Example marketplace",
  "observed_price": 129.99,
  "currency": "USD",
  "availability": "in_stock",
  "collected_at": "YYYY-MM-DDTHH:mm:ssZ"
}
This is a demonstration schema, not a customer record.
3. Normalize and match entities
Before records can be compared, the workflow must determine whether they refer to the same product, company, property, customer, or event.
Matching may depend on:
- SKU
- GTIN, UPC, or EAN
- Brand
- Model number
- Product title
- Variant
- Package size
- Seller
- Address
- Company identifier
- A defined combination of attributes
Weak matching can cause serious analytical errors. A two-pack should not be compared directly with one unit. A refurbished device should not automatically be treated as new. A marketplace seller should not be treated as the manufacturer.
Nenodata’s published price-intelligence service distinguishes between exact, variant, comparable, and unmatched product states where available identifiers and category data support those classifications. Records that cannot be matched confidently should enter a review queue rather than silently flow into a dashboard.
4. Validate records and route exceptions
Validation can combine fixed business rules with AI-assisted interpretation. Common checks include:
- Required fields are present
- Dates use valid formats
- Currency and units are known
- Duplicate records are removed
- Values remain within expected ranges
- Entity relationships are valid
- Source timestamps are sufficiently current
- Record counts remain within expected limits
- Destination schemas are satisfied
- Restricted fields are excluded
A practical exception record might look like this:
{
  "record_id": "REC-10482",
  "validation_status": "review_required",
  "exception_reason": "ambiguous_entity_match",
  "candidate_matches": 3,
  "approved_for_bi": false
}
This is an illustrative example.
The objective is not to force every record through the pipeline. It is to prevent uncertain or invalid records from becoming authoritative BI inputs.
5. Deliver approved data
Validated data may be delivered to:
- A database
- A data warehouse
- An existing BI platform
- An internal dashboard
- An API
- A webhook
- CSV, JSON, or Excel files
- A scheduled report
- An alerting workflow
- A human-review queue
Nenodata’s service pages describe structured delivery options that can include CSV, Excel, JSON, databases, APIs, and API-ready outputs, depending on project scope. See how Nenodata works.
What AI-Ready BI Data Looks Like
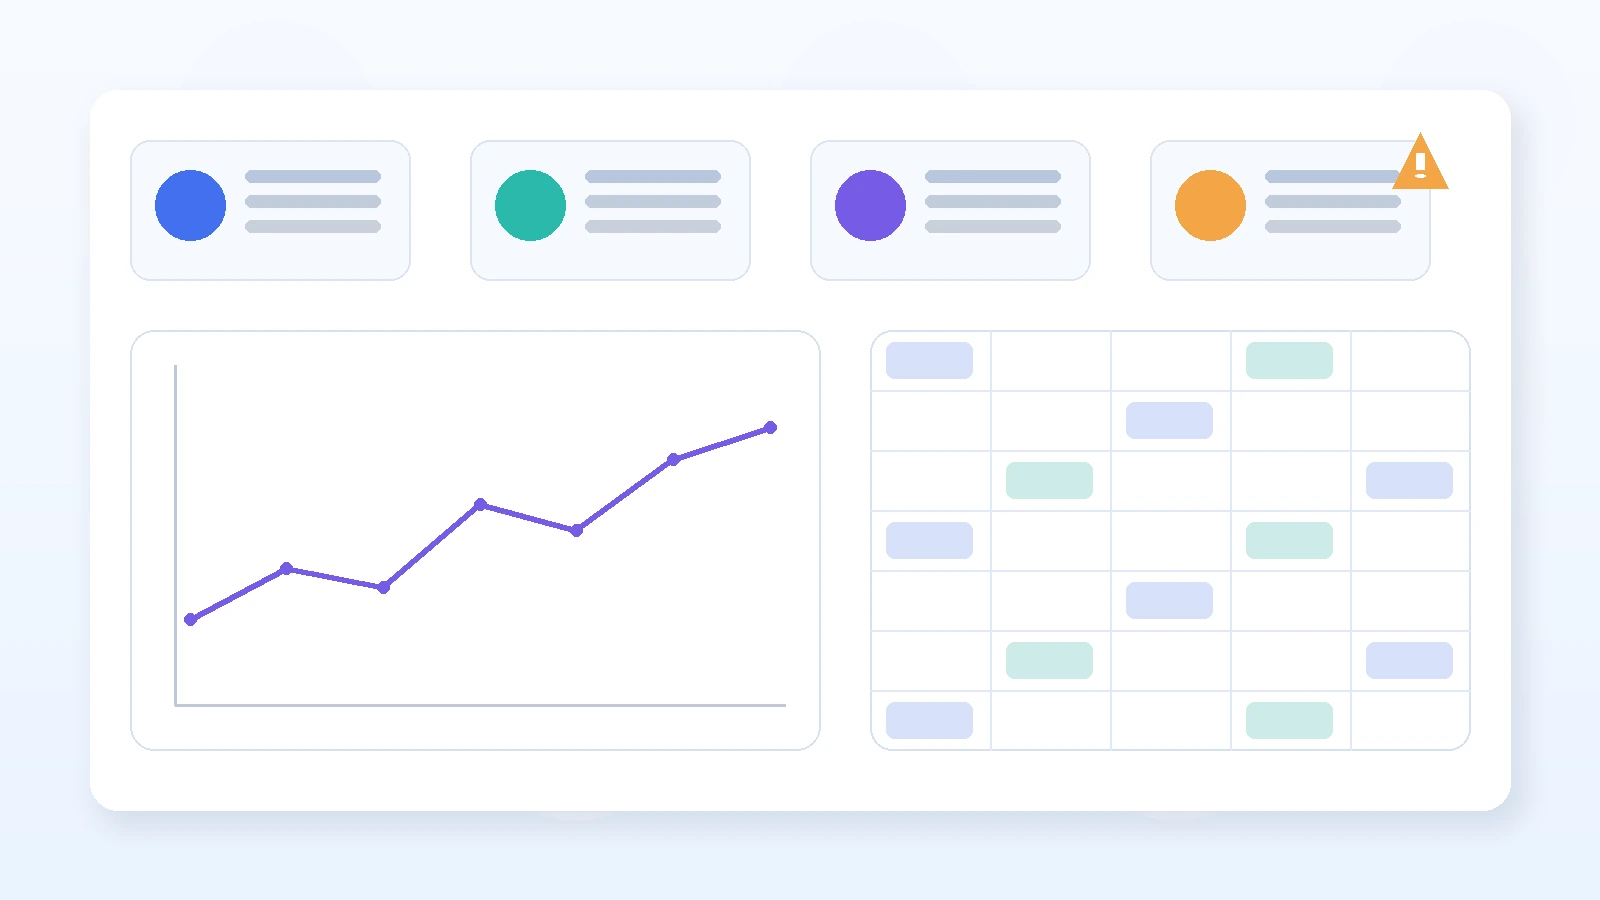
An AI-ready dataset needs more than a metric name and value. Useful operational fields include:
| Field | Why it matters |
|---|---|
source_id | Identifies the system or page supplying the record |
source_url | Supports traceability where appropriate |
collected_at | Shows when the value was observed |
last_success_at | Reveals whether the pipeline is current |
entity_id | Provides a stable entity key |
metric_name | Identifies what was measured |
metric_value | Stores the result |
unit | Prevents invalid comparisons |
currency | Prevents ambiguous monetary analysis |
region | Supports geographic interpretation |
match_status | Shows whether the entity match is exact or uncertain |
validation_status | Shows whether the record passed checks |
exception_reason | Explains why a record was held |
approved_for_bi | Prevents unverified records from entering reports |
destination | Records where the information was delivered |
Nenodata’s published price-intelligence examples support the use of product identifiers, match status, category, brand, variant, price, availability, and listing status as structured analytical fields.
These fields help teams answer more than “What happened?” They can also determine:
- Where the value came from
- When it was collected
- Whether the entity was matched correctly
- Whether the record passed validation
- Which records were excluded
- Whether the source feed is current
- Where the approved record was delivered
Practical AI-for-BI Use Cases
Competitor pricing and assortment intelligence
Business question: Where are competitors changing prices, promotions, availability, and product assortment?
Potential sources include competitor websites, marketplaces, product catalogs, an internal product master, and sales or margin data. AI functions may include product classification, match suggestions, change summaries, anomaly detection, and trend explanation.
Required controls include variant and pack-size matching, seller separation, currency normalization, source-freshness monitoring, and human review for ambiguous matches.
Nenodata’s price intelligence service covers agreed retail sources and can include price, availability, product coverage, matching, and assortment-change signals where supported by identifiers and project scope.
Common mistake: Comparing similar product names without checking pack size, variant, seller, or condition.
Document-based financial intelligence
Document workflows may extract values from PDF invoices, scanned documents, statements, and approved attachments. AI can assist with classification, field extraction, categorization, summaries, and exception explanation, while fixed checks remain important for amounts, dates, identifiers, and totals.
Nenodata publishes an intelligent document processing service covering PDFs, contracts, invoices, reports, scans, and images. Exact accuracy or customer-outcome claims from that service require internal verification before use.
Market and news intelligence
Approved news publishers, public company announcements, industry websites, regulatory publications, and public databases can support entity recognition, topic classification, event clustering, summarization, and trend detection. Controls should include source attribution, publication-date validation, duplicate-event detection, separation of extracted facts and AI interpretation, and human review of consequential summaries.
Review and feedback intelligence
Reviews, support tickets, surveys, and internal feedback can support theme classification, sentiment analysis, aspect extraction, emerging-issue detection, and summary generation. Controls should cover spam and duplicates, language detection, volume and date context, source segmentation, and human review of sensitive conclusions.
Common mistake: Reporting a sentiment percentage without showing review volume, period, language coverage, or source mix.
Operational anomaly detection
Orders, inventory, delivery data, system logs, pipeline-health data, and operational databases can support pattern detection, incident summaries, root-cause suggestions, and prioritization. Required controls include defined baselines, seasonality handling, false-positive tracking, access to contributing records, and human approval before operational changes.
When AI-Powered BI Is a Good Fit
A strong first use case normally has these characteristics:
- The decision occurs frequently.
- The required data can be accessed appropriately.
- Important fields and metrics can be defined.
- Success can be measured.
- Errors can be detected.
- A person can review important outputs.
- The workflow has a clear owner.
- The organization knows which question it needs answered.
A suitable pilot might be:
Identify meaningful competitor price and availability changes each morning, validate product matches, and deliver approved records to the existing BI dashboard.
That is more actionable than “Use AI to improve pricing,” because it defines what should be detected, how often it should run, what must be validated, where the result should go, and how someone will use it.
When to Delay the Project
Delay implementation when:
- Teams disagree about important metric definitions.
- Essential sources are unreliable or inaccessible.
- No one owns data validation.
- Users cannot inspect how an answer was generated.
- High-consequence decisions lack a review process.
- No baseline exists for measuring improvement.
- Source permissions have not been reviewed.
- The project starts with a technology rather than a business decision.
- The team expects AI to repair poor source data automatically.
- The workflow cannot stop safely when a source or model fails.
AI can help identify inconsistent data. It cannot independently resolve every ambiguous business rule.
How to Select the First Pilot
Evaluate candidate projects across five dimensions.
| Criterion | Question |
|---|---|
| Business value | Does this support a frequent or important decision? |
| Data feasibility | Can the required sources and fields be obtained reliably? |
| Measurement | Can results be compared with an existing baseline? |
| Risk | What happens when the answer is wrong? |
| Reviewability | Can a person inspect and correct the output? |
Good early pilots include:
- Summarizing approved weekly metrics
- Flagging anomalies for review
- Classifying incoming records
- Monitoring approved competitor sources
- Drafting report explanations
- Identifying missing or stale data
- Routing uncertain records to a reviewer
Higher-risk first pilots include:
- Automatically changing prices without controls
- Approving financial transactions
- Making employment decisions
- Producing legal or regulatory conclusions
- Triggering customer-facing actions without review
- Generating forecasts from incomplete histories
Start with decision support rather than unrestricted autonomous action.
An Eight-Step Implementation Process
1. Define the business decision
Weak objective: “Improve market intelligence.” Better objective: “Identify price, availability, and assortment changes that category managers need to review each morning.”
2. Inventory the required sources
Document source owner, access method, required fields, refresh requirement, geographic scope, historical requirement, access restrictions, and expected failure conditions. Separate essential sources from optional sources.
3. Define the data contract
Agree on entity identifiers, metric definitions, units, currency, time zone, required fields, null handling, match status, validation status, lineage, and approval state. The contract should be understandable to business, engineering, and BI teams.
4. Build collection and preparation workflows
Use the appropriate method for each source: API connection, database query, file ingestion, document extraction, website extraction, schema mapping, entity matching, and deduplication. Do not assume that every source behaves consistently.
5. Add validation and approval controls
Define which checks are automatic, which failures block delivery, which records enter a review queue, who approves ambiguous results, what happens when a source becomes stale, when the system retries, and when the workflow stops.
6. Connect the AI and BI layers
The AI layer should receive approved data, business definitions, permitted sources, user-access rules, instructions for ambiguity, prohibited actions, and escalation rules. Microsoft’s Power BI guidance recommends preparing models with AI schemas, verified answers, and instructions. Google recommends starting conversational-analytics rollouts with a controlled scope and validating results before broader adoption.
7. Test normal and failure scenarios
Include missing fields, duplicate entities, stale sources, unexpected values, ambiguous questions, conflicting metric definitions, permission restrictions, unsupported questions, source-layout changes, and delivery failures. A trustworthy system should fail visibly and safely.
8. Monitor and improve
Track source availability, collection success, record counts, match exceptions, validation failures, delivery status, user corrections, unsupported questions, answer verification, and adoption. Use corrections to improve schemas, instructions, validation rules, and source coverage.
Build, Buy, or Extend the Existing BI Stack?
| Option | Best when | Main advantage | Main limitation |
|---|---|---|---|
| Use native AI in the current BI platform | Data is already centralized and governed | Faster adoption | Limited by existing data quality and platform scope |
| Add a specialist AI layer | Advanced conversational or domain-specific capabilities are required | Greater flexibility | Additional integration and governance |
| Build a custom workflow | Sources, rules, or decisions are highly specialized | Control over logic and outputs | Engineering and maintenance effort |
| Use a data-automation partner | External or unstructured data is the main obstacle | Focused source-to-output implementation | Requires clear scope and vendor governance |
A custom data workflow becomes relevant when the primary limitation is not the dashboard but the absence of dependable data entering it. Examples include:
- Competitor information distributed across websites
- Financial fields trapped in PDFs
- Market events distributed across public sources
- Product catalogs with inconsistent identifiers
- Reviews requiring classification
- Multiple APIs using different schemas
Risks and Controls
NIST describes its AI Risk Management Framework as a voluntary resource for incorporating trustworthiness considerations into the design, development, use, and evaluation of AI systems. It does not guarantee compliance or remove the need for organization-specific risk assessment.
| Failure mode | Possible symptom | Business risk | Recommended control |
|---|---|---|---|
| Poor metric definition | Similar questions produce conflicting answers | Inconsistent decisions | Approved semantic definitions |
| Stale source | Dashboard appears current but uses old records | Outdated decisions | Freshness fields and delivery blocking |
| Incorrect entity match | Wrong products or companies are compared | Misleading analysis | Match rules and review queue |
| Missing records | Sudden unexplained trend | False conclusion | Coverage and record-count checks |
| Unsupported AI response | Confident answer lacks supporting evidence | Poor decisions and lost trust | Grounding and abstention rules |
| Incorrect query generation | Wrong joins or filters | Inaccurate report | Query inspection and verified questions |
| Excessive automation | System acts outside approved scope | Operational or financial harm | Permissions and approval gates |
| Hidden exceptions | Failed records disappear silently | Incomplete reporting | Visible exception metrics |
| Source bias | One channel dominates the evidence | Unrepresentative conclusion | Source segmentation and coverage reporting |
| Access-control failure | User sees restricted information | Data exposure | Role-based access and permission testing |
How to Measure Success
Data-workflow metrics
- Source coverage
- Collection completion
- Match rate
- Validation pass rate
- Duplicate rate
- Exception volume
- Source freshness
- Delivery success
- Recovery time following a source change
Do not publish benchmark percentages unless they have been tested and approved.
AI and analytics metrics
- Questions answered using approved sources
- Unsupported-answer rate
- User correction rate
- Query-verification rate
- Classification performance on an approved test set
- Forecast error where forecasting is used
- Percentage of outputs requiring review
Business metrics
- Decision-cycle time
- Analyst-request backlog
- Time spent preparing recurring reports
- Time required to identify exceptions
- User adoption
- Number of decisions supported
- Financial impact where attribution is credible
Dashboard usage alone does not demonstrate business value. The implementation should improve a defined decision or workflow.
How Nenodata Can Support the Data Layer
Nenodata should not be presented as a replacement for Power BI, Tableau, Looker, or another BI platform.
Its relevant role is the data-extraction, preparation, validation, and delivery layer that can sit before or alongside an existing analytics environment.
Based on Nenodata’s current service pages, a scoped project may include:
- Reviewing approved sources and required fields
- Collecting data from websites, APIs, documents, or databases
- Mapping records into an agreed schema
- Normalizing and deduplicating fields
- Matching entities where available identifiers support it
- Applying validation rules
- Holding ambiguous records for review
- Delivering structured outputs into files, databases, APIs, warehouses, or reporting workflows
- Maintaining configured extraction workflows as supported sources change
The precise sources, integrations, refresh schedules, and outputs depend on technical feasibility, access conditions, and the agreed scope. Related pages: workflow automation services · enterprise data solutions.
Need dependable data for an AI or BI workflow?
Define your required sources, fields, validation rules, refresh expectations, and destination system with Nenodata.
Discuss Your Data WorkflowAI-for-BI Readiness Checklist
Before approving a pilot, confirm that:
- The business decision is clearly defined.
- The intended users are known.
- Required sources are identified.
- Source permissions and boundaries have been reviewed.
- Metrics have approved definitions.
- Entity-matching rules exist.
- Freshness requirements are documented.
- Validation rules are defined.
- Exception owners are assigned.
- Human-approval points are documented.
- The destination system is known.
- AI access respects user permissions.
- Normal and failure scenarios can be tested.
- Success metrics have a baseline.
- The system can reveal uncertainty.
- The workflow can stop safely.
AI-powered business intelligence works best when it is treated as a controlled information system rather than a chatbot attached to a dashboard.
AI can make analysis faster and easier to access. The source data, metric definitions, validation rules, and review controls determine whether its output deserves to influence a business decision.
Share your sources, required fields, and delivery destination to discuss your data workflow and assess a practical first workflow.
Sources
- Microsoft Learn — Power BI Copilot and AI model preparation
- Google Cloud — Looker Conversational Analytics documentation
- NIST — AI Risk Management Framework
- Nenodata — Services
- Nenodata — Price Intelligence
- Nenodata — Document Processing
- Nenodata — Workflow Automation
- Nenodata — How It Works
Platform capabilities are attributed only to the cited vendor. NIST is used for risk-management framing, not as proof of compliance. Nenodata case-study figures and performance claims are excluded pending internal approval.